Node Monitoring and Timeline Replay for the Smart Cockpit Agent
Addressing the practical debugging question of whether an agent actually called downstream APIs, using an ordered event stream for live node monitoring and frontend prefix replay while handling loop span pairing, SSE subscription races, and thread limits.
Once the Smart Cockpit workflow started returning answers, I ran into a practical question during internal demos and joint debugging: when the page shows “599 yuan refundable,” viewers still want to know how that number was produced. Did it actually query the order service? Why did round two switch tools? What inputs did each of the three specialists receive?
Checking backend logs in a terminal works, but jumping back and forth between console output and the browser breaks the flow of explanation and slows down troubleshooting. When merging the workflow into the Smart Cockpit (enterprise-ai-cockpit repository), I added a structured execution record to the workbench so node transitions can be observed live and inspected step by step afterward.
The record covers the entire customer-service main graph, not just the tool loop and multi-agent branches. RAG, image understanding, MCP report queries, human handoff, and both feedback retry paths pass through the same node wrapper into a single ordered event sequence, making it straightforward to compare a direct hit against a retry loop in the same view.
Separating live monitoring, timeline replay, and human recovery
At its core, node monitoring and replay rely on an append-only list of ordered execution events rather than a heavy distributed tracing stack or state-machine rewind engine.
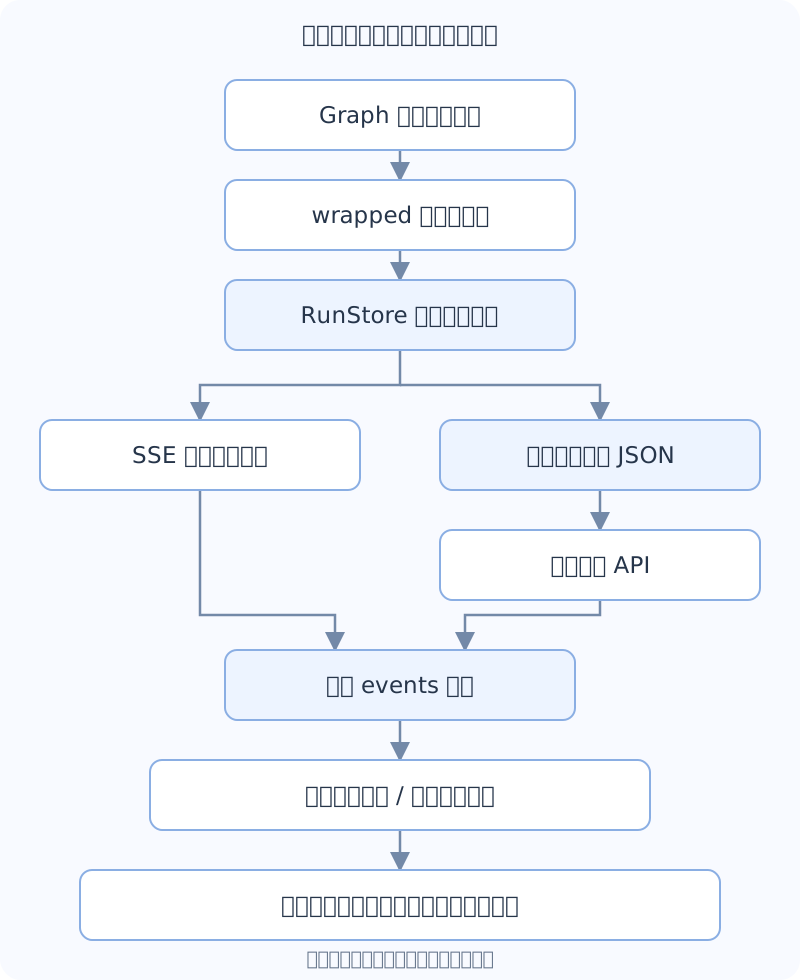
Before wiring up the UI, three operations need clear boundaries:
| Mode | What changes | Advances backend execution? |
|---|---|---|
| Live monitoring | Appends incoming SSE events and updates the view | Yes. The backend Graph is running; the browser only observes |
| Timeline replay | Moves the truncation cursor on the frontend event array | No. Reads recorded events without calling models, HTTP APIs, or MCP tools |
| Human recovery | Submits staff review notes to run HumanResumeGraph | Yes. Resumes a waiting run and emits new events |
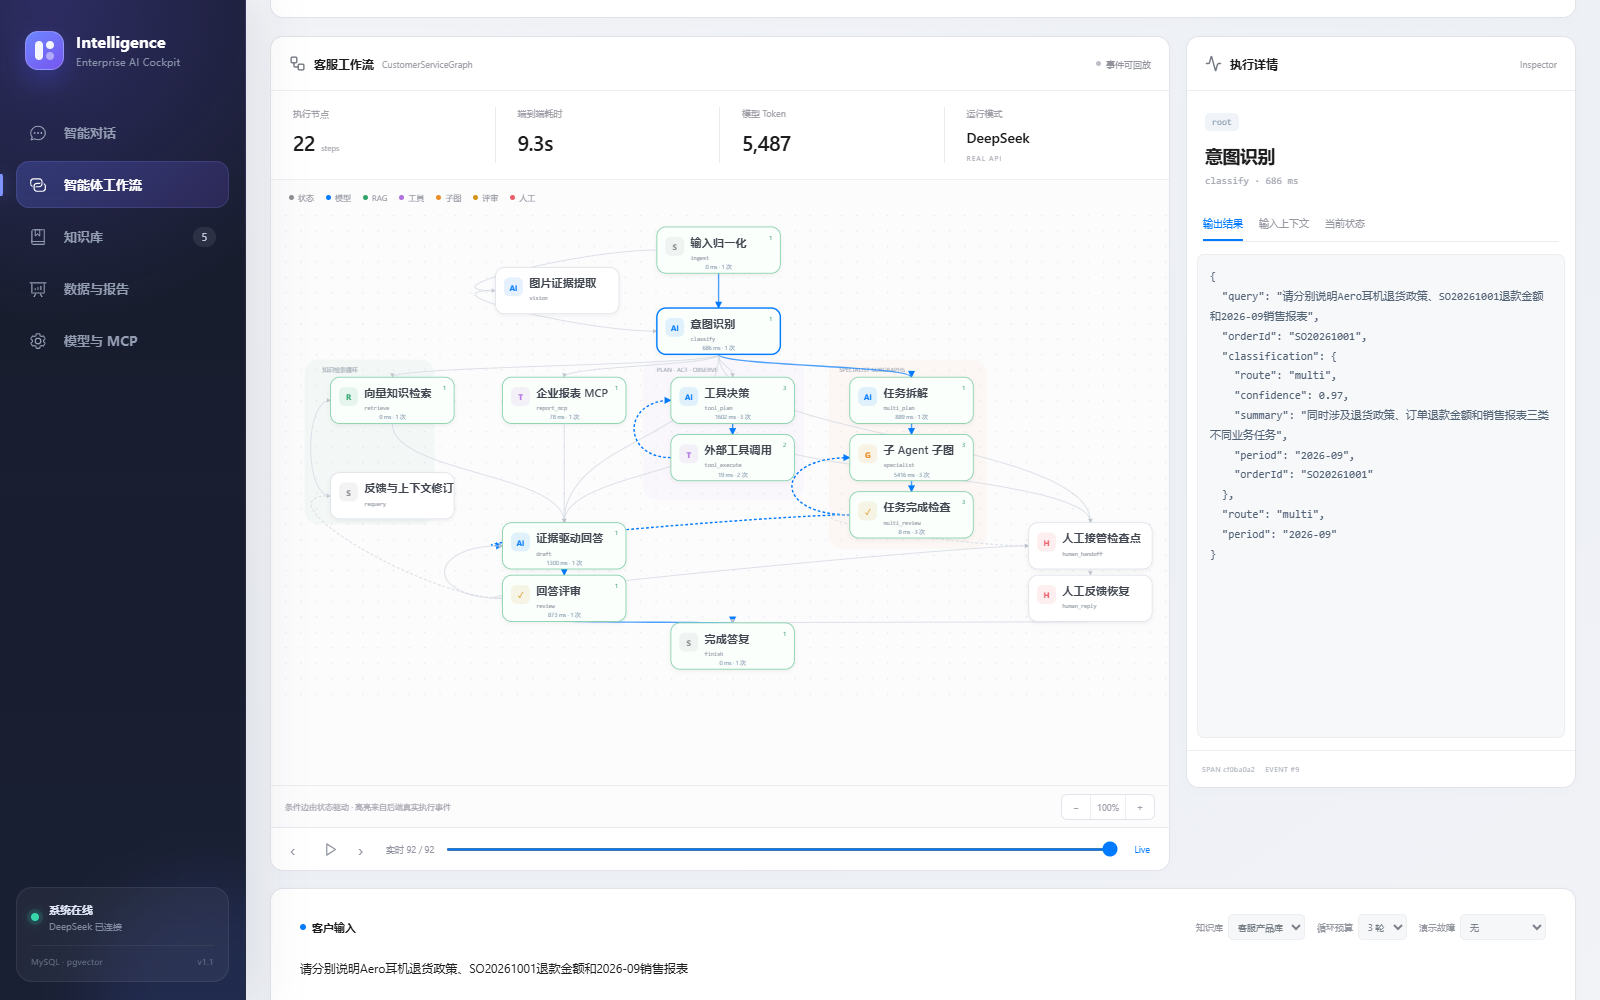
Keeping these separate avoids UI ambiguity:
- “Pause replay” only stops the frontend playback timer without interrupting a running backend task;
- “Stop current workflow” explicitly asks the backend to cancel the active run;
- “Current status” in the detail panel always reflects the latest run state rather than rolling back with the replay cursor. Historical node inputs and outputs can be inspected, though this version replays recorded snapshots rather than re-executing arbitrary nodes.
Verifying the record across eight scenario entries
During acceptance testing, instead of only checking whether nodes turned green, I verified what could actually be inspected in the trace across all eight workbench scenarios:
| Scenario | What is verified in the trace |
|---|---|
| Product knowledge RAG | Knowledge sources, similarity scores, and queries returned by retrieve, plus cited evidence |
| Images and text | Whether vision observations (such as fault code E02) entered downstream classification and retrieval |
| Enterprise report MCP | Actual report payload from report_mcp, rather than the model claiming it checked |
| Tool call loop | Tool name, arguments, observation result, duration, and distinct Span per tool_execute round |
| Multi-Agent collaboration | Three specialist paths, outer parent Span, subgraph nodes, and final aggregation inputs |
| Human takeover | run.waiting, handoff context, run.resumed, and human_reply, without repeating earlier steps |
| Feedback-driven re-retrieval | A requery step between two retrieve calls with an updated query string |
| Tool exceptions and budget | Failed observations retained in state; three-round recovery vs. two-round human handoff exits |
After each run, I reopened history, exported JSON, reset the replay bar to zero, and stepped through to completion to confirm no new model or order requests were triggered. Waiting tasks can also be cancelled so abandoned demo runs do not stay stuck in a waiting state.
Knowledge maintenance and the guided tour remain workbench entry points rather than fake Agent nodes inside the main graph: one prepares retrievable documents and the other loads sample inputs, while monitoring tracks what happens after an input enters the Graph.
Unified node wrapper and loop identifiers
Wrapping nodes instead of scattering log calls
Writing manual logging inside every node handler duplicates code and risks dropping completion events on uncaught exceptions. When registering nodes in WorkflowEngine, both the main graph and specialist subgraphs pass through a shared wrapped higher-order function:
String span = newSpanId();
emit("node.started", nodeId, path, span, input);
long started = System.nanoTime();
try {
    Map<String, Object> delta = businessStep(input);
    emit("node.completed", nodeId, path, span,
         Map.of("output", delta, "durationMs", elapsed(started)));
    return delta;
} catch (Exception e) {
    emit("node.failed", nodeId, path, span, publicError(e));
    throw e;
}
Model calls are recorded separately with started/completed/failed events, model name, purpose, and token usage, with parentSpanId pointing to the enclosing node. The UI displays requests, public outputs, and structured routing decisions rather than internal chain-of-thought. Static node coordinates come from /api/workflow/graph, while runtime events drive edge traversal and node status.
node.completed.output intentionally stores only the returned state delta (delta). Treating a delta as the full State during inspection would make unmodified fields look as if they had been cleared.
Pairing loop and subgraph executions beyond nodeId
In a tool loop, tool_execute runs multiple times, and the order specialist subgraph reuses the same node name internally. Matching start and completion events by nodeId alone would mix up round-one inputs with round-two outputs.
Each event therefore carries six identifiers:
| Field | Role in the cockpit |
|---|---|
traceId | Identifies the entire run (matches Run ID in this project) |
nodeId | Logical node name, such as tool_execute |
spanId | Unique execution instance ID; repeated loop rounds get distinct spanIds |
parentSpanId | Links a model call or subgraph event to its enclosing call |
path | Graph path, root for the main graph or root/toolAgent[3] for a specialist |
seq | Monotonically increasing sequence number within a Run for replay catch-up and deduplication |
Inputs and outputs are paired by spanId + path. Specialist lifecycle markers share the outer specialist Span, so including path prevents pulling in the outer state snapshot; [3] indicates the task index in the current run rather than a hardcoded slot.
Duration metrics follow a similar rule: the outer specialist duration already includes its subgraph execution, so summing all node durations directly would double-count parent and child spans. End-to-end run latency uses the first-to-last event interval, while node latency reflects either a single span or cumulative time for same-named nodes.
Two SSE delivery details
Each Run stores ordered events in RunStore and streams Flux<ServerSentEvent<TraceEvent>> over the cockpit’s existing Spring WebFlux stack.
Replaying history and subscribing under the same lock
When a browser subscribes to an active run, the server replays events after the client cursor and registers the live listener inside the same Run lock. Splitting those two steps leaves a small window where an event emitted in between is neither in the history slice nor delivered to the new subscriber.
id: 19
event: trace
data: {"seq":19,"type":"node.completed","nodeId":"tool_execute",...}
EventSource deduplicates incoming trace events by seq. On reconnect, the server takes the larger of after and Last-Event-ID. During human waiting, a 15-second ID-less heartbeat keeps reverse-proxy connections alive without advancing the replay cursor.
Disabling reverse-proxy buffering
Responses set X-Accel-Buffering: no and Cache-Control: no-cache so Nginx forwards SSE chunks immediately instead of buffering them until run completion and lighting up the whole graph at once.
Prefix-based timeline replay on the frontend
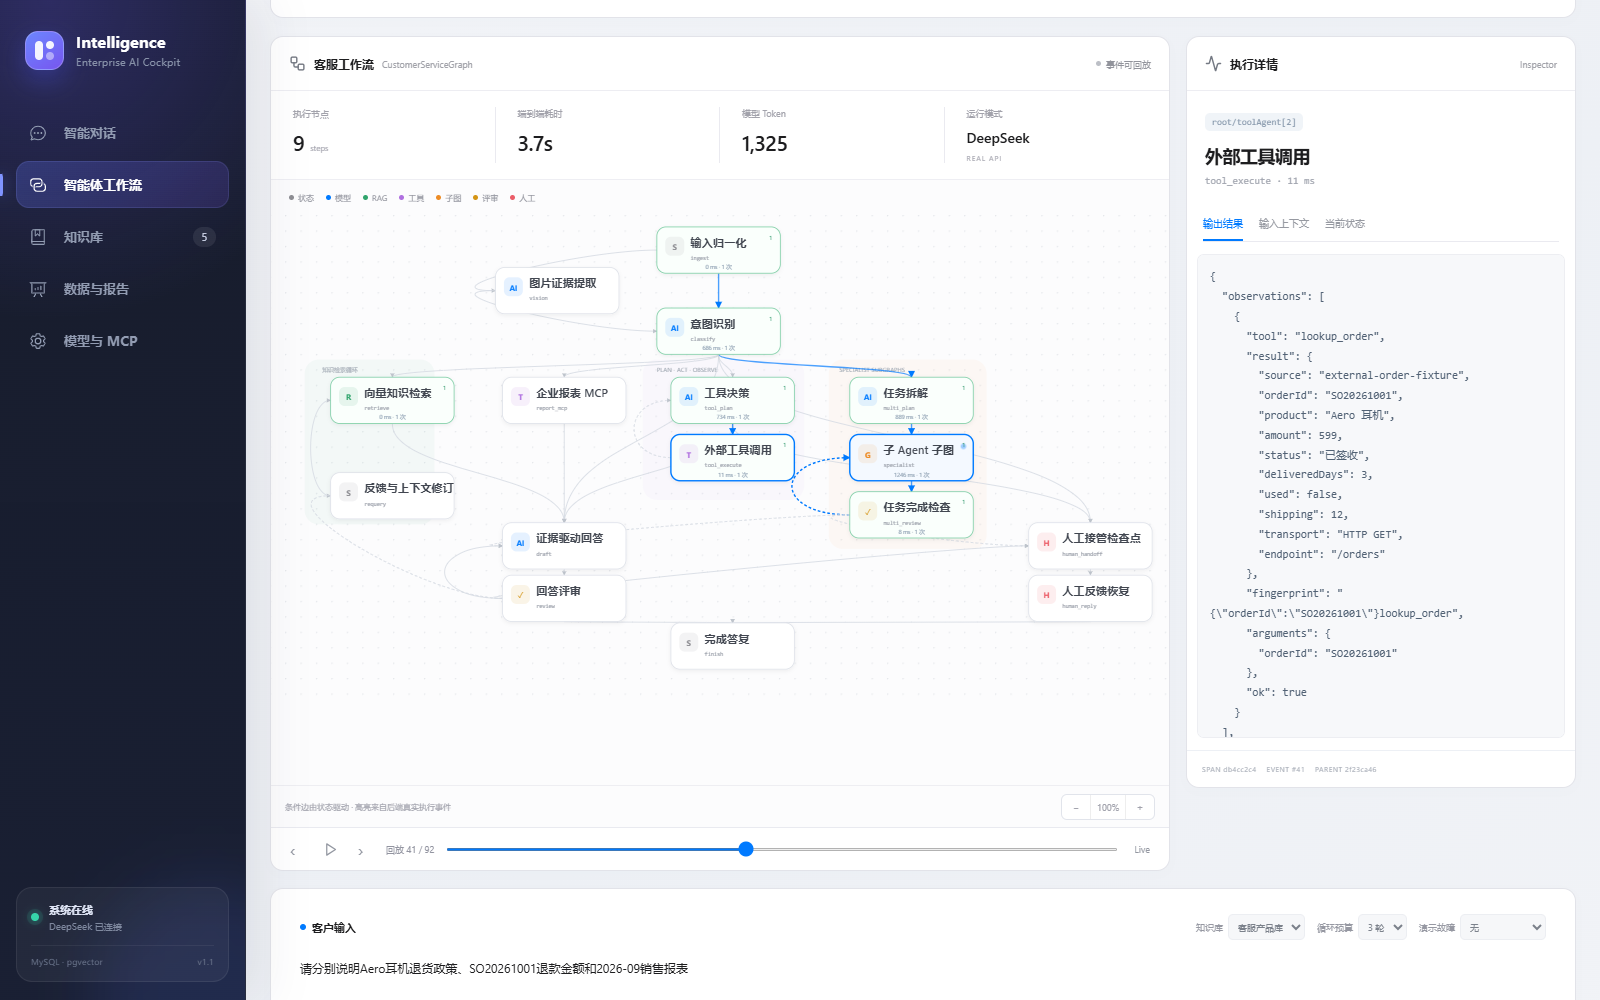
The frontend stores the full events array and derives the replay view from an array prefix:
const visibleEvents = computed(() =>
  trackLive.value ? events.value : events.value.slice(0, cursor.value)
)
Node status, execution counts, traversed edges, tool rounds, and specialist cards are all computed from visibleEvents, avoiding separate animation timers.
Two implementation details matter in practice:
- The cursor is an array index, not
seq: a single node emits edge traversal,node.started, andnode.completedevents, so stepping forward jumps to the nextnode.completedindex rather than incrementingseq. Continuous playback steps every 600ms for readability rather than reproducing wall-clock pauses. - Node completion differs from tool success: when a downstream HTTP timeout is caught and returned as
toolOutcome.ok = false, the node itself has fulfilled its job of recording a failed observation, emittingnode.completedwhile marking the tool card as failed.
Debugging a native thread limit failure
During full online regression across all eight scenarios, one run completed timeout retry, order lookup, and the 599-yuan refund calculation, then failed at review. Instead of guessing whether the model or refund API had timed out again, checking the node trace pointed straight to java.lang.OutOfMemoryError: unable to create new native thread. WebFlux workers, SSE streams, HTTP clients, and the MCP subprocess together had reached the container’s 90-thread limit. Raising the cockpit thread limit to 128—while keeping CPU and memory caps unchanged—resolved all eight online scenarios.
Persistence boundaries and data masking
Run snapshots are written as JSON via temporary-file write plus atomic rename at root boundaries, completion, human recovery, and cancellation under shared/workflow/runs, surviving frontend or JAR deployments.
This storage is checkpoint-based rather than flushing every emit to disk; an abrupt process crash can lose events after the last checkpoint. Leftover RUNNING entries are marked INTERRUPTED on startup, while waiting runs resume via HumanResumeGraph from saved application state rather than arbitrary-node framework checkpoints. Up to 100 runs are kept on disk (40 returned via API), stripping internal control fields, raw image bytes, and api-key values; connecting real customer data later will still require dedicated field-level masking, access control, and retention policies.
From writing agentDemo for an engineering talk to integrating the full workflow and replay workbench into the Smart Cockpit, one shift stood out clearly: the engineering focus of AI agents is moving beyond prompt tuning alone toward stateful backend orchestration and frontend observability.
You can try timeline replay directly on the Smart Cockpit workflow page, and read about the state-graph design in the previous article.